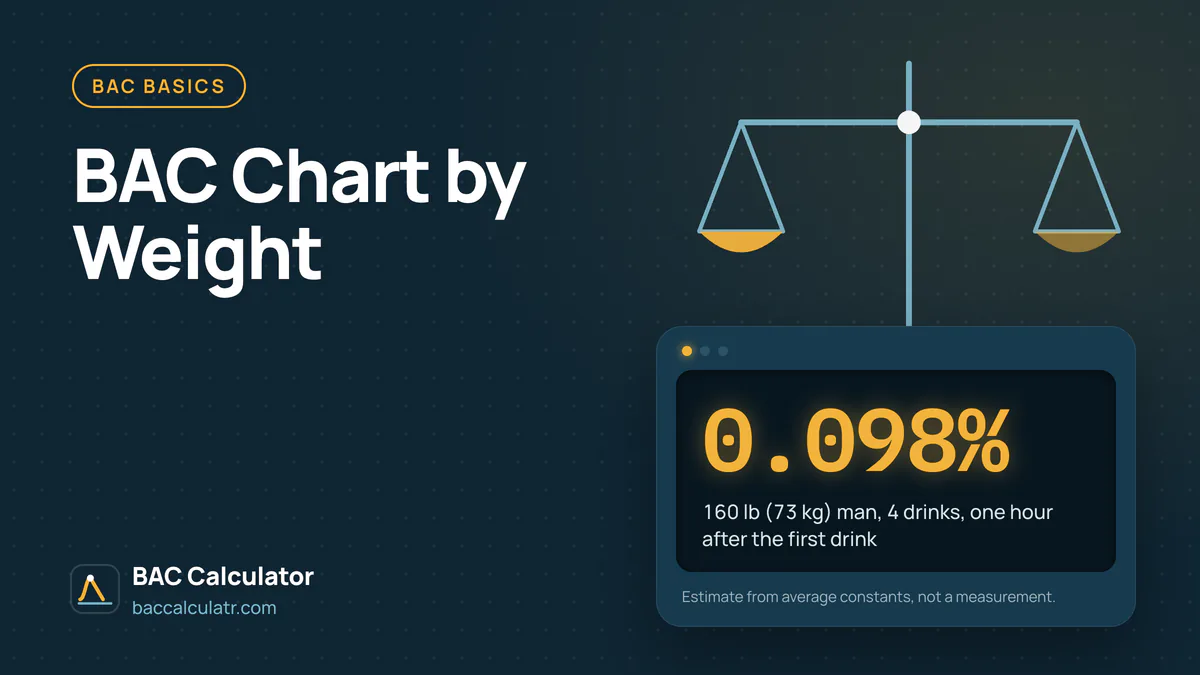
BAC Chart by Weight
A BAC chart by weight gives the estimated blood alcohol for your body weight, sex and number of US standard drinks, where one drink holds 14 g of pure alcohol. At 160 lb (73 kg), 4 drinks put a man near 0.098% and a woman near 0.125% one hour after the first drink. The tables below cover 100 to 260 lb and 1 to 8 drinks, at 1 hour and 3 hours.
One hour after the first drink
Women get the higher estimate from the same drinks because the Widmark formula gives them a lower body water factor, r. More body weight means more body water to dilute the same grams of alcohol, so every row falls from left to right. Four drinks give a 120 lb man 0.136% at 1 hour and a 200 lb man 0.076%. The men's and women's tables share columns, so this BAC chart for men and women compares both sexes cell by cell. Each half is a blood alcohol level chart by weight.
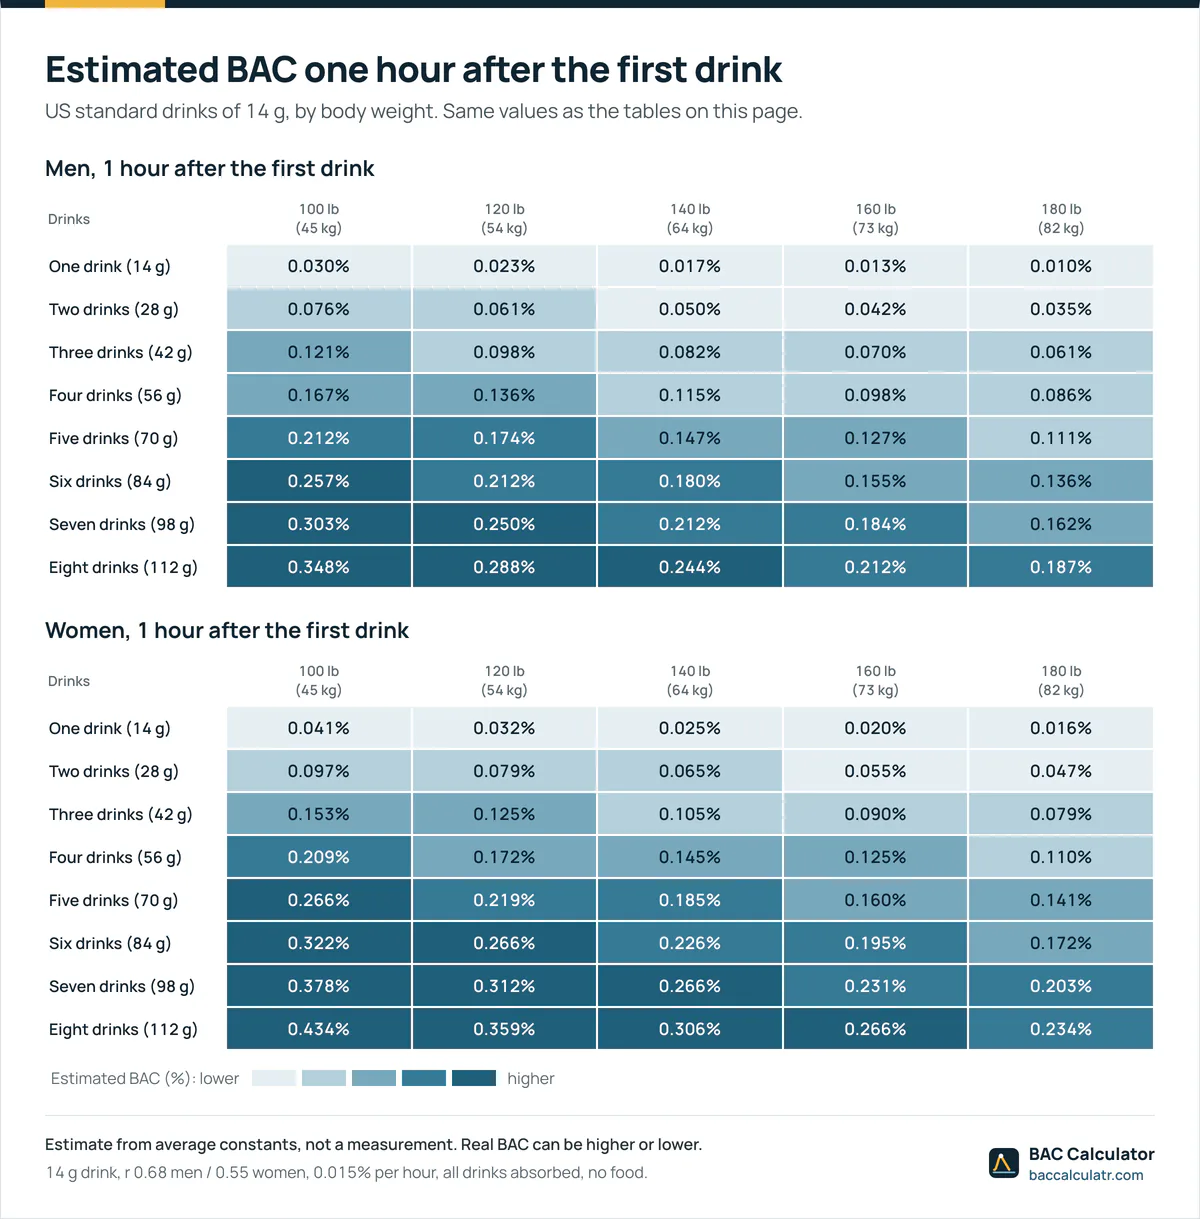
The inputs are a 14 g drink and 0.015% removed per hour from the first drink. The body water factor r is 0.68 in the men's tables and 0.55 in the women's. Every drink counts as fully absorbed, with no food. The BAC calculator turns your own weight, drink count and hours into a personal estimate. The bottom rows at light weights reach the range linked to alcohol poisoning. If someone who drank that much cannot be woken or is breathing slowly, call emergency services, then check the signs of alcohol poisoning.
Men at 1 hour
| Drinks | 100 lb (45 kg) | 120 lb (54 kg) | 140 lb (64 kg) | 160 lb (73 kg) | 180 lb (82 kg) |
|---|---|---|---|---|---|
| One drink (14 g) | 0.030% | 0.023% | 0.017% | 0.013% | 0.010% |
| Two drinks (28 g) | 0.076% | 0.061% | 0.050% | 0.042% | 0.035% |
| Three drinks (42 g) | 0.121% | 0.098% | 0.082% | 0.070% | 0.061% |
| Four drinks (56 g) | 0.167% | 0.136% | 0.115% | 0.098% | 0.086% |
| Five drinks (70 g) | 0.212% | 0.174% | 0.147% | 0.127% | 0.111% |
| Six drinks (84 g) | 0.257% | 0.212% | 0.180% | 0.155% | 0.136% |
| Seven drinks (98 g) | 0.303% | 0.250% | 0.212% | 0.184% | 0.162% |
| Eight drinks (112 g) | 0.348% | 0.288% | 0.244% | 0.212% | 0.187% |
Scroll for more weights
| Drinks | 200 lb (91 kg) | 220 lb (100 kg) | 240 lb (109 kg) | 260 lb (118 kg) |
|---|---|---|---|---|
| One drink (14 g) | 0.008% | 0.006% | 0.004% | 0.002% |
| Two drinks (28 g) | 0.030% | 0.026% | 0.023% | 0.020% |
| Three drinks (42 g) | 0.053% | 0.047% | 0.042% | 0.037% |
| Four drinks (56 g) | 0.076% | 0.068% | 0.061% | 0.055% |
| Five drinks (70 g) | 0.098% | 0.088% | 0.080% | 0.072% |
| Six drinks (84 g) | 0.121% | 0.109% | 0.098% | 0.090% |
| Seven drinks (98 g) | 0.144% | 0.129% | 0.117% | 0.107% |
| Eight drinks (112 g) | 0.167% | 0.150% | 0.136% | 0.125% |
Scroll for more weights
Women at 1 hour
| Drinks | 100 lb (45 kg) | 120 lb (54 kg) | 140 lb (64 kg) | 160 lb (73 kg) | 180 lb (82 kg) |
|---|---|---|---|---|---|
| One drink (14 g) | 0.041% | 0.032% | 0.025% | 0.020% | 0.016% |
| Two drinks (28 g) | 0.097% | 0.079% | 0.065% | 0.055% | 0.047% |
| Three drinks (42 g) | 0.153% | 0.125% | 0.105% | 0.090% | 0.079% |
| Four drinks (56 g) | 0.209% | 0.172% | 0.145% | 0.125% | 0.110% |
| Five drinks (70 g) | 0.266% | 0.219% | 0.185% | 0.160% | 0.141% |
| Six drinks (84 g) | 0.322% | 0.266% | 0.226% | 0.195% | 0.172% |
| Seven drinks (98 g) | 0.378% | 0.312% | 0.266% | 0.231% | 0.203% |
| Eight drinks (112 g) | 0.434% | 0.359% | 0.306% | 0.266% | 0.234% |
Scroll for more weights
| Drinks | 200 lb (91 kg) | 220 lb (100 kg) | 240 lb (109 kg) | 260 lb (118 kg) |
|---|---|---|---|---|
| One drink (14 g) | 0.013% | 0.011% | 0.008% | 0.007% |
| Two drinks (28 g) | 0.041% | 0.036% | 0.032% | 0.028% |
| Three drinks (42 g) | 0.069% | 0.062% | 0.055% | 0.050% |
| Four drinks (56 g) | 0.097% | 0.087% | 0.079% | 0.071% |
| Five drinks (70 g) | 0.125% | 0.113% | 0.102% | 0.093% |
| Six drinks (84 g) | 0.153% | 0.138% | 0.125% | 0.115% |
| Seven drinks (98 g) | 0.181% | 0.164% | 0.149% | 0.136% |
| Eight drinks (112 g) | 0.209% | 0.189% | 0.172% | 0.158% |
Scroll for more weights
Every cell is an estimate from an average-based formula, never a measurement. A 1986 California Department of Motor Vehicles (DMV) study of BAC charts tested this approach. Charts built on population averages, paired with a per-hour subtraction, can underestimate BAC for many people.
BAC chart by weight and time
At 3 hours, every cell reads 0.030% lower than at 1 hour, because the chart takes off 0.015% per hour, down to 0.000%. Hours count from the first drink, not the last, so a night that began at 9 pm is 3 hours old at midnight.
Men at 3 hours
| Drinks | 100 lb (45 kg) | 120 lb (54 kg) | 140 lb (64 kg) | 160 lb (73 kg) | 180 lb (82 kg) |
|---|---|---|---|---|---|
| One drink (14 g) | 0.000% | 0.000% | 0.000% | 0.000% | 0.000% |
| Two drinks (28 g) | 0.046% | 0.031% | 0.020% | 0.012% | 0.005% |
| Three drinks (42 g) | 0.091% | 0.068% | 0.052% | 0.040% | 0.031% |
| Four drinks (56 g) | 0.137% | 0.106% | 0.085% | 0.068% | 0.056% |
| Five drinks (70 g) | 0.182% | 0.144% | 0.117% | 0.097% | 0.081% |
| Six drinks (84 g) | 0.227% | 0.182% | 0.150% | 0.125% | 0.106% |
| Seven drinks (98 g) | 0.273% | 0.220% | 0.182% | 0.154% | 0.132% |
| Eight drinks (112 g) | 0.318% | 0.258% | 0.214% | 0.182% | 0.157% |
Scroll for more weights
| Drinks | 200 lb (91 kg) | 220 lb (100 kg) | 240 lb (109 kg) | 260 lb (118 kg) |
|---|---|---|---|---|
| One drink (14 g) | 0.000% | 0.000% | 0.000% | 0.000% |
| Two drinks (28 g) | 0.000% | 0.000% | 0.000% | 0.000% |
| Three drinks (42 g) | 0.023% | 0.017% | 0.012% | 0.007% |
| Four drinks (56 g) | 0.046% | 0.038% | 0.031% | 0.025% |
| Five drinks (70 g) | 0.068% | 0.058% | 0.050% | 0.042% |
| Six drinks (84 g) | 0.091% | 0.079% | 0.068% | 0.060% |
| Seven drinks (98 g) | 0.114% | 0.099% | 0.087% | 0.077% |
| Eight drinks (112 g) | 0.137% | 0.120% | 0.106% | 0.095% |
Scroll for more weights
Women at 3 hours
| Drinks | 100 lb (45 kg) | 120 lb (54 kg) | 140 lb (64 kg) | 160 lb (73 kg) | 180 lb (82 kg) |
|---|---|---|---|---|---|
| One drink (14 g) | 0.011% | 0.002% | 0.000% | 0.000% | 0.000% |
| Two drinks (28 g) | 0.067% | 0.049% | 0.035% | 0.025% | 0.017% |
| Three drinks (42 g) | 0.123% | 0.095% | 0.075% | 0.060% | 0.049% |
| Four drinks (56 g) | 0.179% | 0.142% | 0.115% | 0.095% | 0.080% |
| Five drinks (70 g) | 0.236% | 0.189% | 0.155% | 0.130% | 0.111% |
| Six drinks (84 g) | 0.292% | 0.236% | 0.196% | 0.165% | 0.142% |
| Seven drinks (98 g) | 0.348% | 0.282% | 0.236% | 0.201% | 0.173% |
| Eight drinks (112 g) | 0.404% | 0.329% | 0.276% | 0.236% | 0.204% |
Scroll for more weights
| Drinks | 200 lb (91 kg) | 220 lb (100 kg) | 240 lb (109 kg) | 260 lb (118 kg) |
|---|---|---|---|---|
| One drink (14 g) | 0.000% | 0.000% | 0.000% | 0.000% |
| Two drinks (28 g) | 0.011% | 0.006% | 0.002% | 0.000% |
| Three drinks (42 g) | 0.039% | 0.032% | 0.025% | 0.020% |
| Four drinks (56 g) | 0.067% | 0.057% | 0.049% | 0.041% |
| Five drinks (70 g) | 0.095% | 0.083% | 0.072% | 0.063% |
| Six drinks (84 g) | 0.123% | 0.108% | 0.095% | 0.085% |
| Seven drinks (98 g) | 0.151% | 0.134% | 0.119% | 0.106% |
| Eight drinks (112 g) | 0.179% | 0.159% | 0.142% | 0.128% |
Scroll for more weights
Where a cell reads 0.000%, the formula expects no alcohol left at that hour. Your real BAC can still sit above zero, because people clear alcohol at different speeds.
Only time lowers a cell, so coffee and other sober-up myths leave the number where it was. Counting from your cell down to 0.00 is done hour by hour in the sobering-up timetable.
Why the chart reads at 1 hour
An empty-stomach round usually peaks close to the one-hour mark, so that table sits near the top for those drinks. The 3-hour table shows the same drinks after 2 more hours of clearing, and neither follows BAC while alcohol is still being absorbed.
Do heavier people clear alcohol faster?
Not on the chart, where every weight loses 0.015% per hour. A heavier body starts from a lower cell; it does not fall faster, which is why the 3-hour columns keep the same order as the 1-hour ones.
How to read a BAC chart by weight
Find your weight column, go down to your drink count, then pick the table for your hours. Take a 220 lb (100 kg) man, 5 standard drinks, 3 hours after the first.
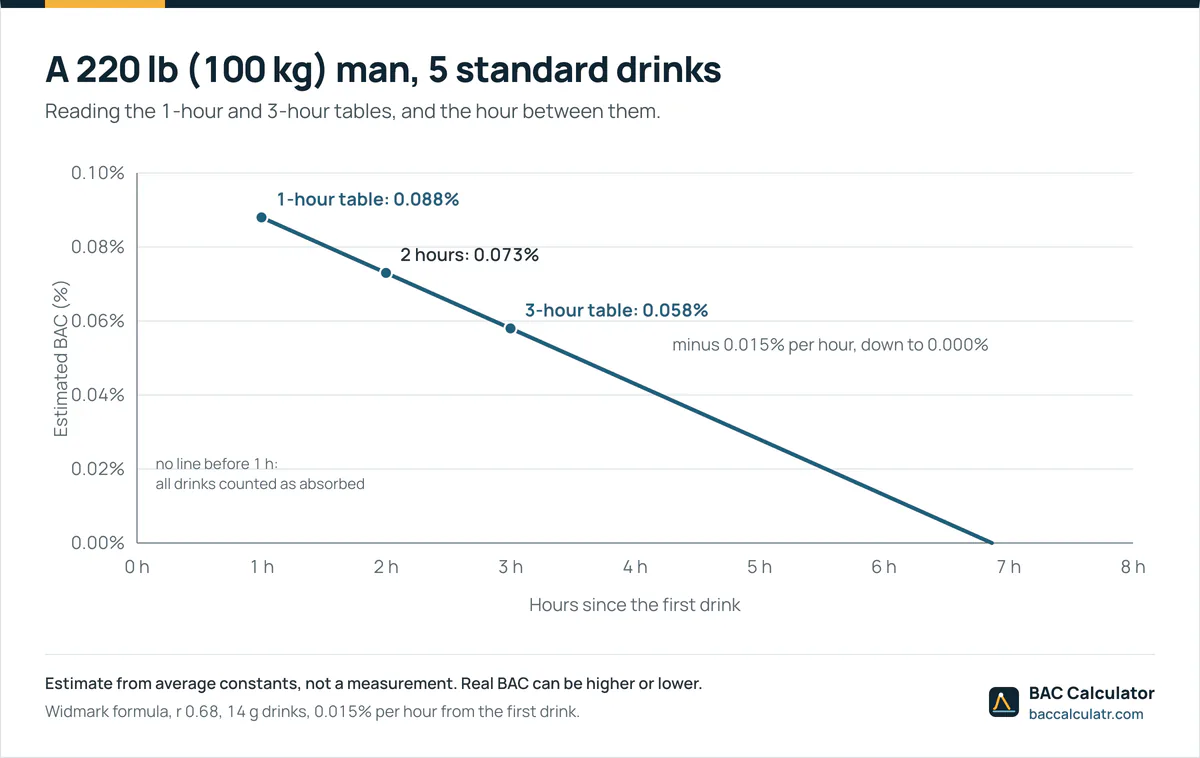
- In the men's 1-hour table, the 220 lb column meets the five-drink row at 0.088%.
- Three hours is 2 hours past that table, at 0.015% per hour: 0.088% minus 2 x 0.015% = 0.058%.
- The men's 3-hour table shows 0.058% in the same cell, since one formula built both.
Each row down adds one drink, so the chart doubles as a BAC per drink chart. A single beer, glass or shot gets its own table in BAC after one beer.
Hours between the two tables
For 2 hours, take one more 0.015% off the 1-hour cell: the same man reads 0.088% minus 0.015% = 0.073%. Past 3 hours, keep subtracting 0.015% per hour until you reach 0.000%.
Weights between the columns
Read the lighter column when your weight falls between two. It gives the higher estimate, so a 230 lb man uses the 220 lb column.
Is a BAC chart for blood or breath?
Blood. Each cell is a blood figure in grams per 100 mL, the same unit US limits use. A breath test reads exhaled air instead, and each test type finds alcohol for a different stretch, as how long alcohol lingers for each test shows.
Why BAC charts give different numbers
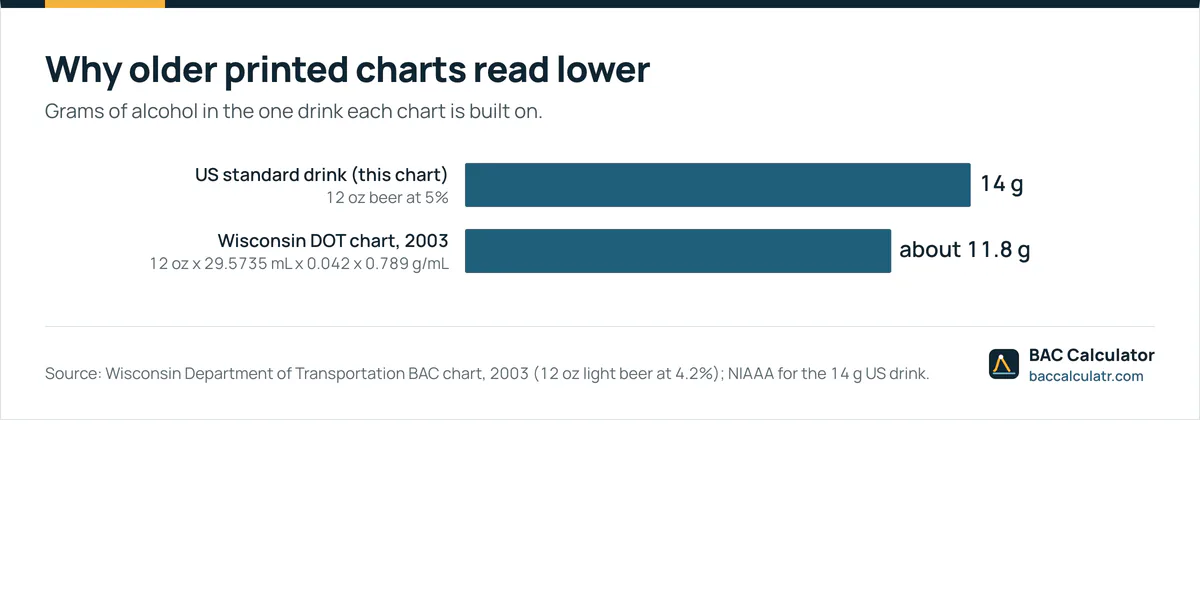
Printed charts disagree because they assume different drink sizes, elimination rates and food.
Older state charts used a smaller drink
Older state charts such as the Wisconsin Department of Transportation's 2003 BAC chart counted a 12 oz light beer at 4.2% as one drink. That beer holds about 11.8 g of alcohol (12 oz x 29.5735 mL x 0.042 x 0.789 g/mL). So a BAC chart by weight built on it reads lower than one built on 14 g.
| What the chart assumes | This chart | Wisconsin Department of Transportation (DOT) chart, 2003 |
|---|---|---|
| One drink | 12 oz beer at 5%, 5 oz wine at 12% or 1.5 oz spirits at 40% ABV | 12 oz beer at 4.2%, 4 oz wine at 12 to 13% or 1.25 oz 80-proof liquor |
| Alcohol per drink | 14 g | about 11.8 g |
| Hourly subtraction | 0.015% for men and women | 0.015% for men, 0.018% for women |
| Food | all drinks absorbed, no food | "for drinking without eating" |
Scroll for more weights
Food, pours and slower clearance
Food slows absorption, so the cells run high for someone who ate. A craft beer or a big wine pour can hold more than one drink, so check the standard drink size of each pour before you pick a row. Clearance varies too: a 2010 review by A. W. Jones puts it at 0.010% to 0.035% per hour, and a slower eliminator sits above the 3-hour cell.
Does height change your BAC?
Not on this chart, which uses only weight and sex. Body water formulas such as Watson's add height, so two people of the same weight can hold different amounts of water and reach different BACs.
Using the number from the chart
Read your cell against the limit line where you drive, using the table for your hours rather than the 1-hour table alone. The BAC limits by state table lists the US 0.08% line, Utah's 0.05% and the lower limits for some drivers. A cell under a line does not mean unimpaired. A 160 lb man's estimate crosses 0.08% at about 3.3 drinks in the first hour, and the drink count where each weight first reaches 0.08% covers the other weights. A regular drinker's cell reads the same as anyone's at that weight, even if the drinks needed to feel drunk differ from person to person. What each BAC level means shows what your cell typically does to the body and to driving.
FAQ
Does the chart work with UK units?
Yes, once you turn your count into grams. Each row adds one US drink of 14 g, while a UK unit holds 8 g and an Australian standard drink 10 g. Seven UK units come to 56 g, the four-drink row.
What if you weigh under 100 lb?
Your estimate sits above the 100 lb column for the same drinks, because less body water dilutes the alcohol, so treat the 100 lb figure as a floor. Above 260 lb it works the other way, and your estimate falls below the 260 lb column.
Does a double shot count as two rows?
Yes. A double is 3 oz of spirits at 40% ABV, two 1.5 oz pours of 14 g each, so it moves you to the 28 g row. A 1.5 oz pour at 100 proof is 1.25 drinks on its own.
How do you count light beer on the chart?
Count each 12 oz light beer at 4.2% as a little under one row, since it holds about 11.8 g against the chart's 14 g. Six light beers carry about as much alcohol as the five-drink row's 70 g.
Conclusion
Treat your cell as a middle estimate rather than a ceiling, because a slow clearer or a pour bigger than 14 g ends up above it. Australian drivers hold that figure against 0.05 on a full licence and zero on L or P plates, per the drink driving limit in each Australian state.